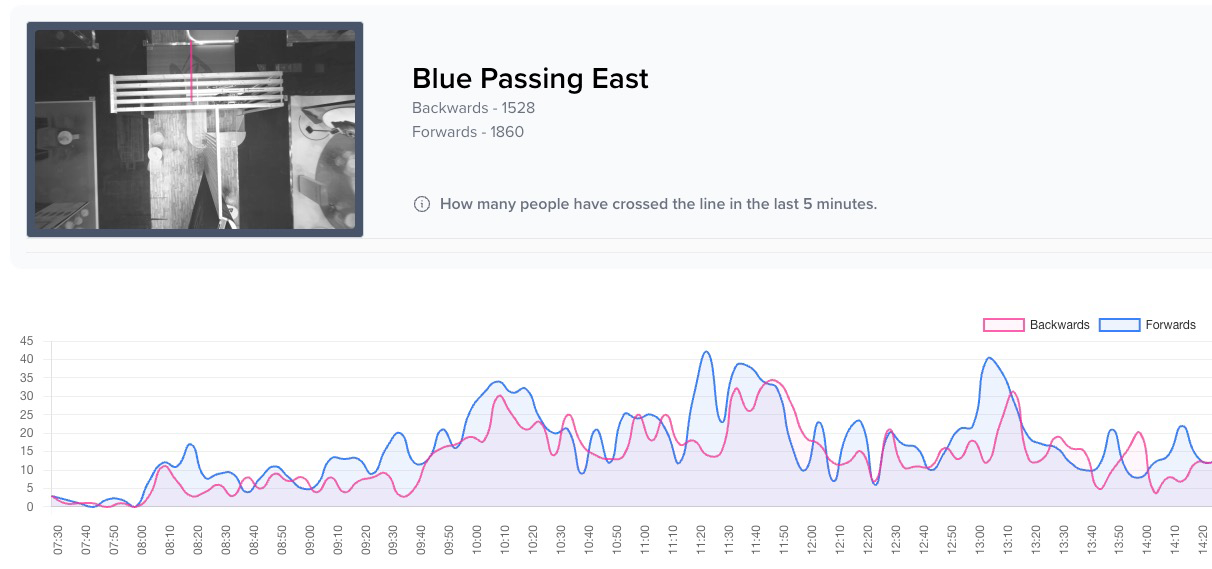
Entry and exit counts are key for organisers/ production directors who want to understand how spaces/areas/attractions/activations are used by visitors/attendees.
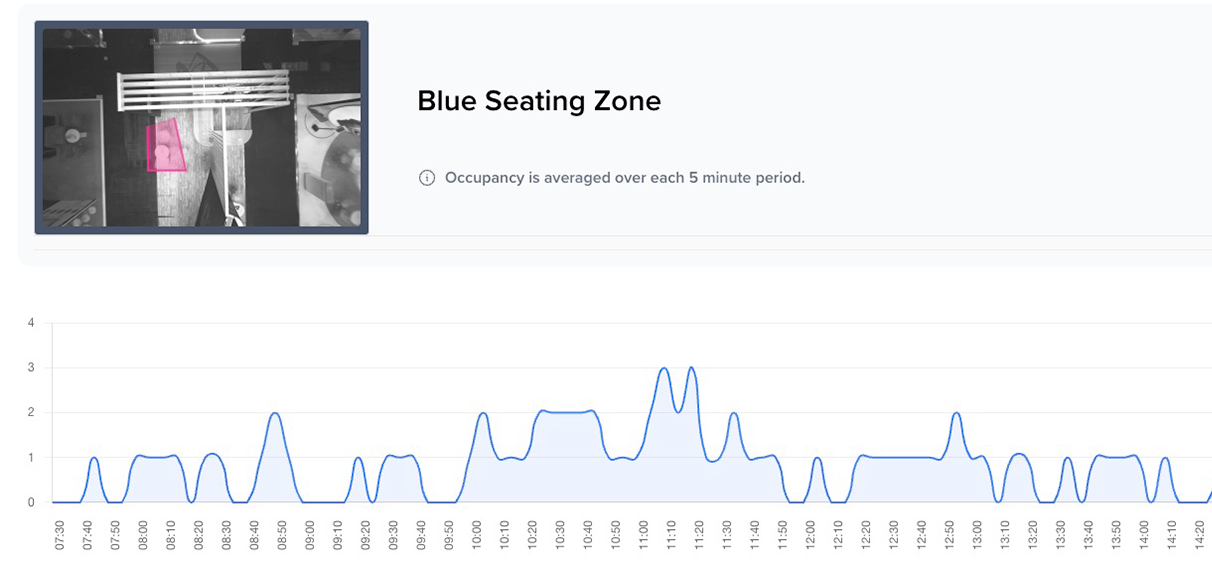
As any organiser can tell you, even small changes in the placement of restroom facilities, food outlets, bars, covered areas, merchandising, and concession areas can significantly impact an event’s success. Decision-making about structuring the event area can be optimised using real-time and historical data about how visitors/attendees utilise different spaces.
With this data, it enables the user to make strategic decisions about security and safety protocols, priority number one at live events. Knowing real- time visitor flows helps experiential agencies, production houses, festival owners make fact-based decisions.
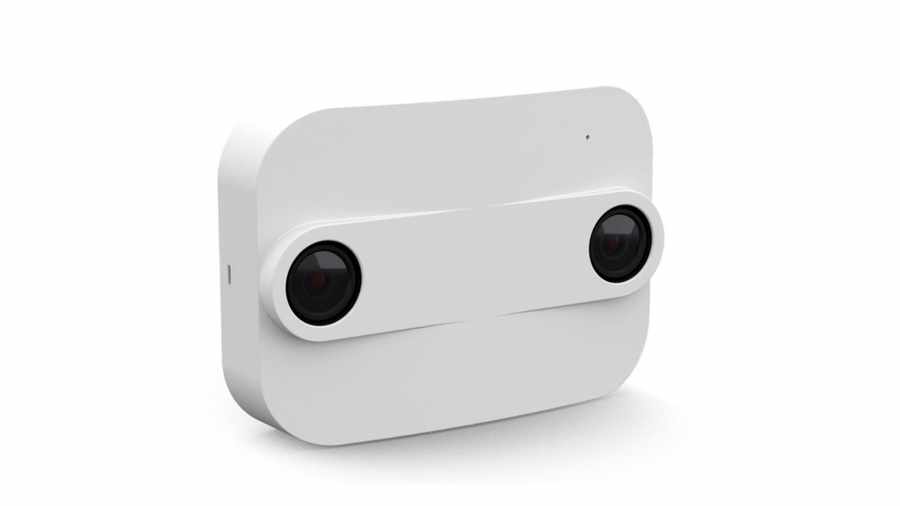
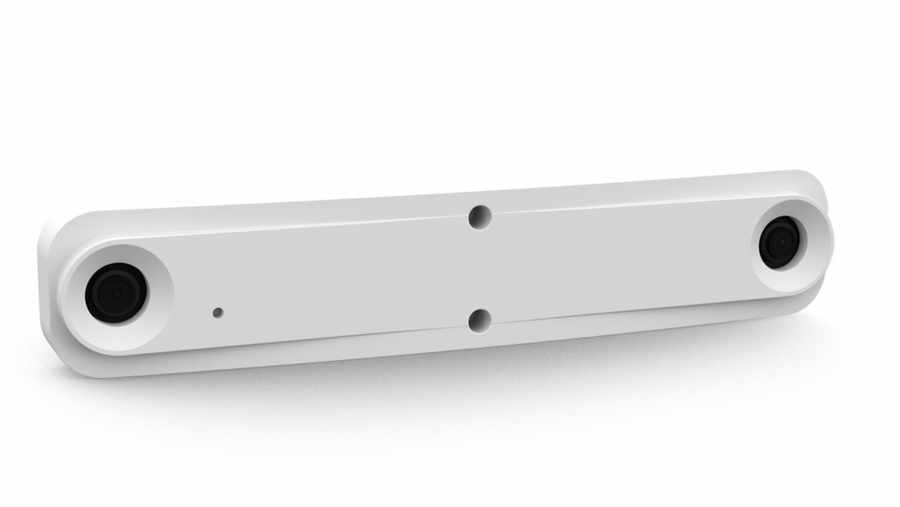
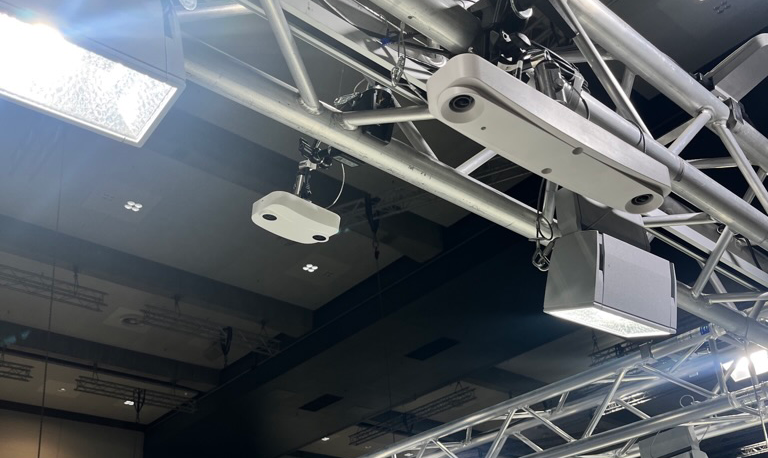
The Sensors master people counting with high precision, The 3D stereo vision technology permits accurate people counting up to 99.9%, and enables people counting in real time. Although the sensors look simple by design they provide very smart functionality.
The sensors are mounted at height, from a minimum of 2.5 meters up to a maximum of 20 meters. And provide multiple zones or line counts per device , area and mounting location permitting.
Counting from above, the sensors count only heads and the movement underneath their measuring area. This provides a privacy focused solution with no biometric tracking. The computer vision models are trained for dense environments and down to very low light conditions making a perfect solution in experiential, exhibition and retail scenarios.
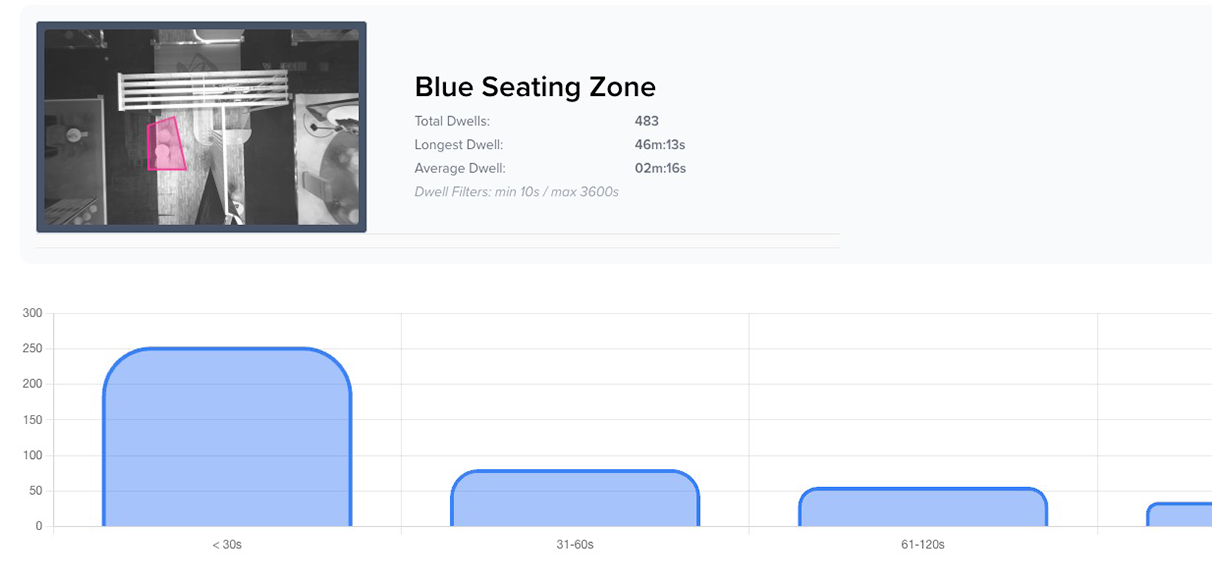
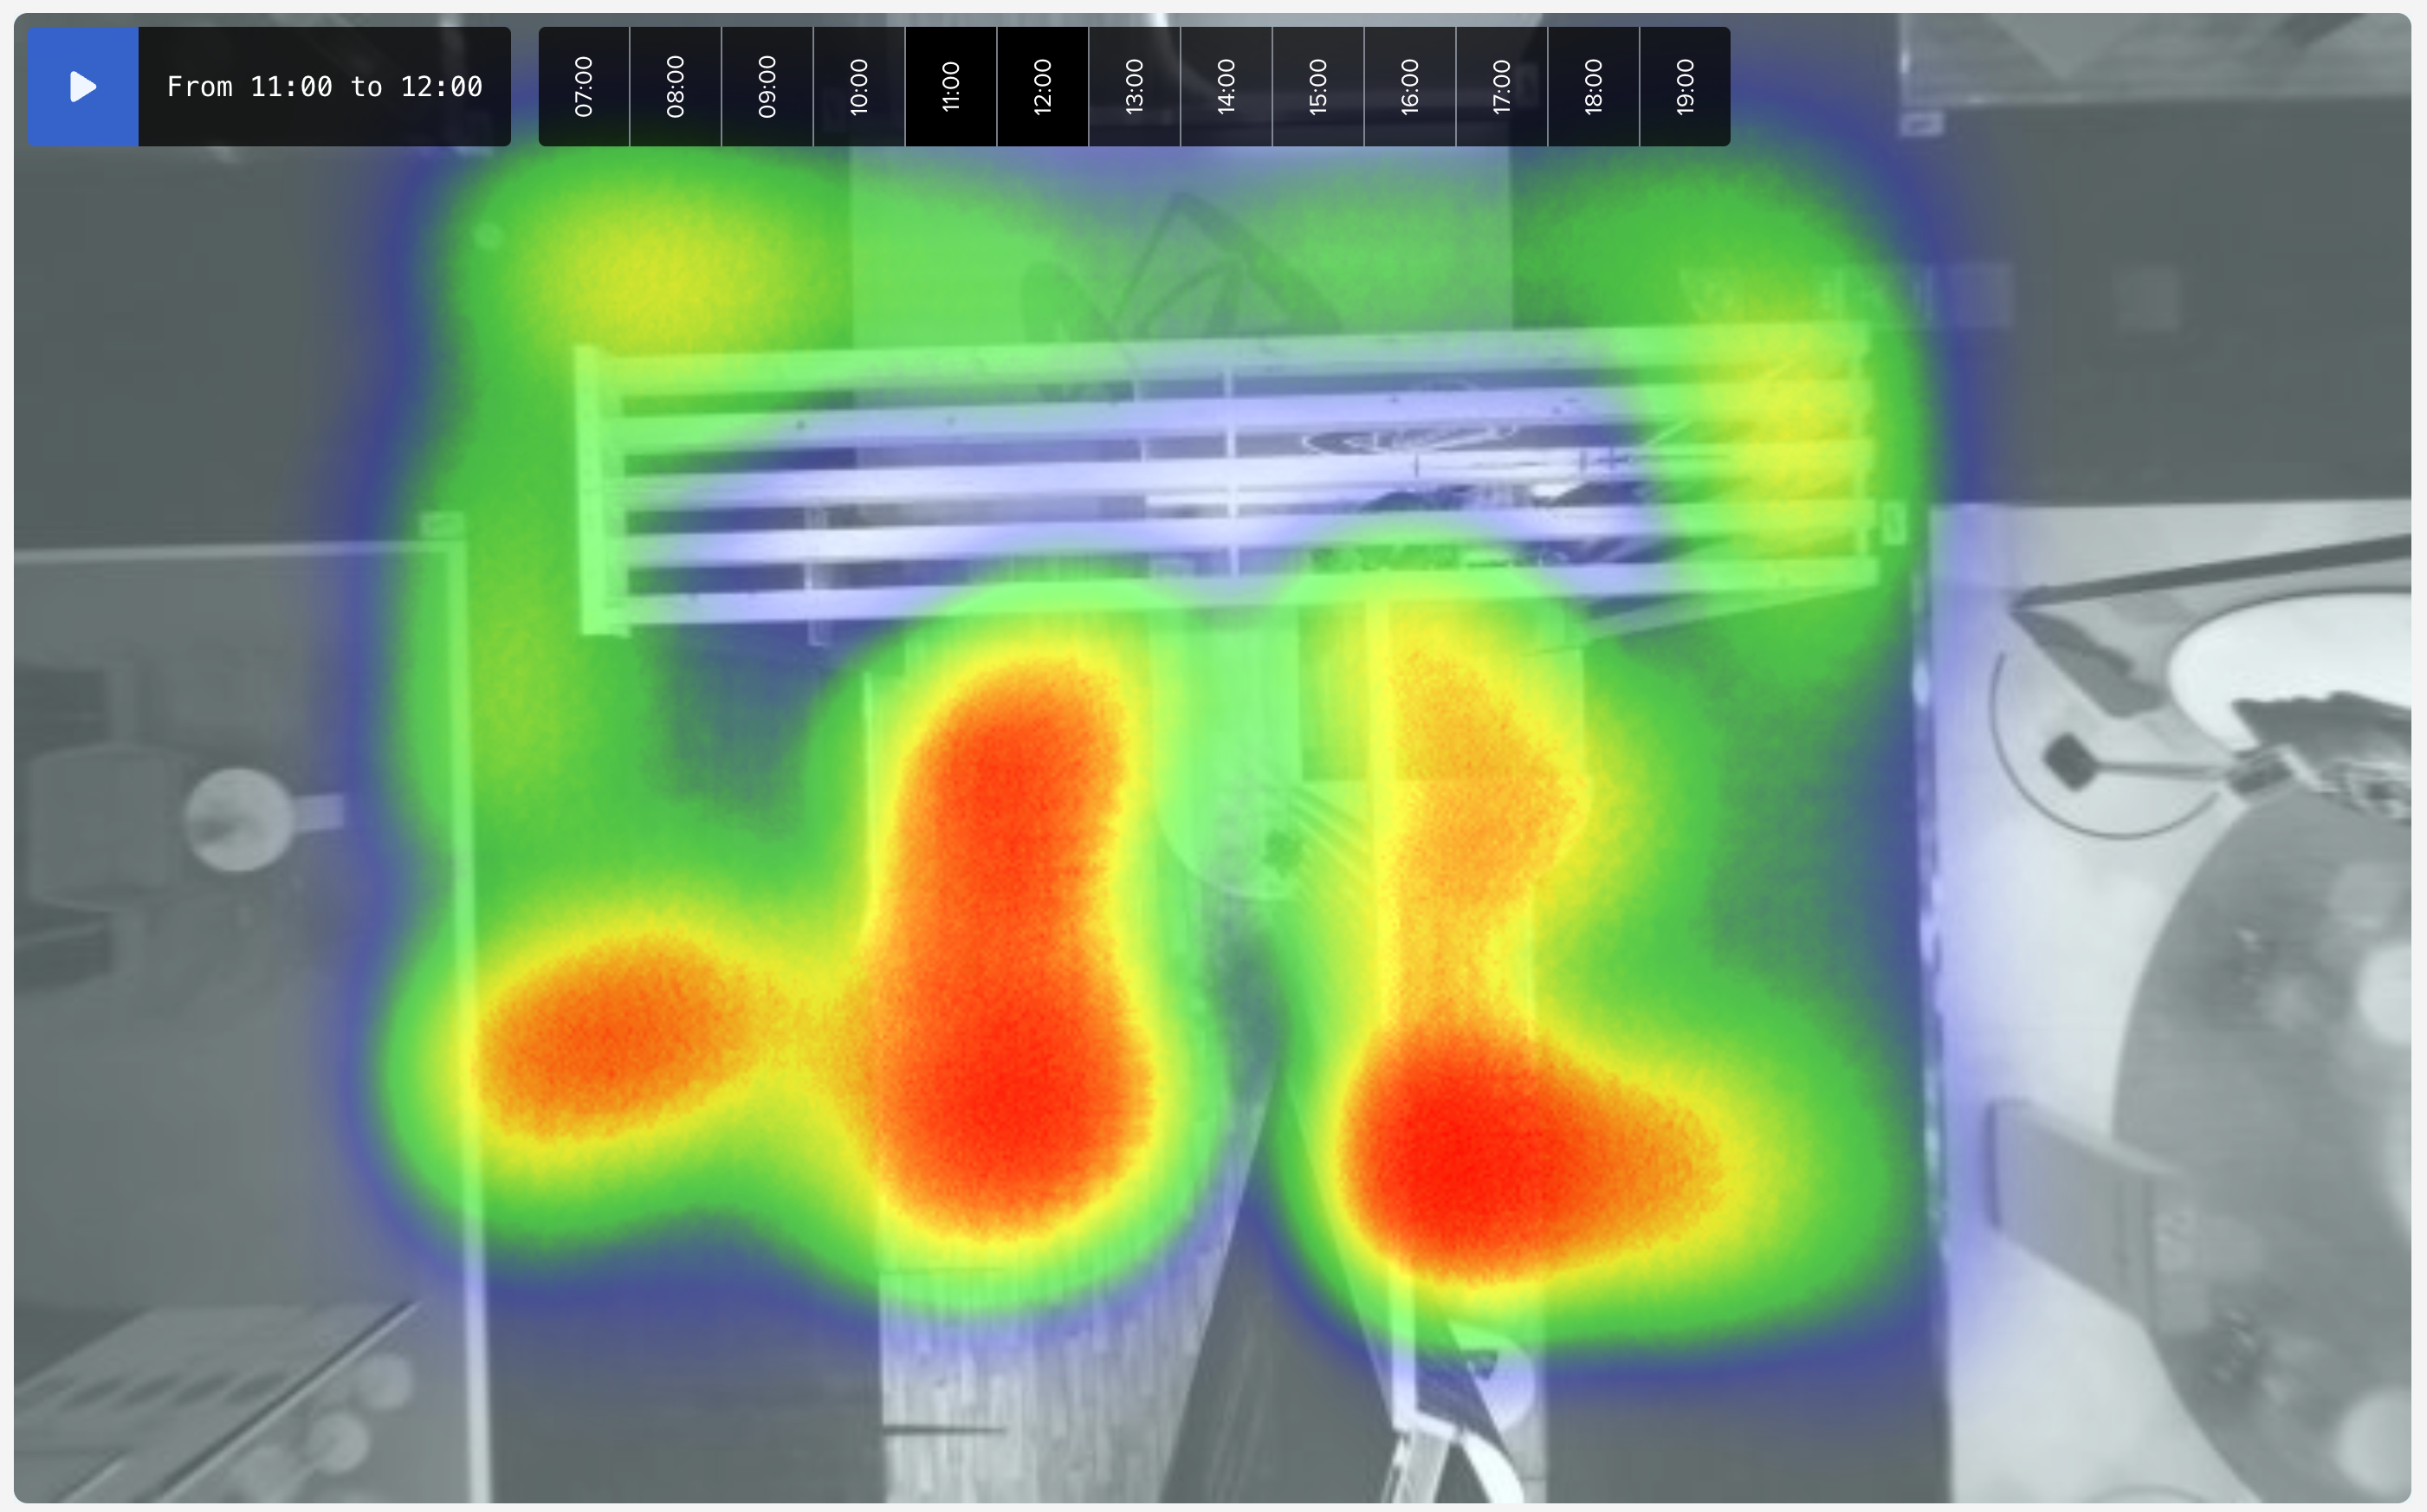
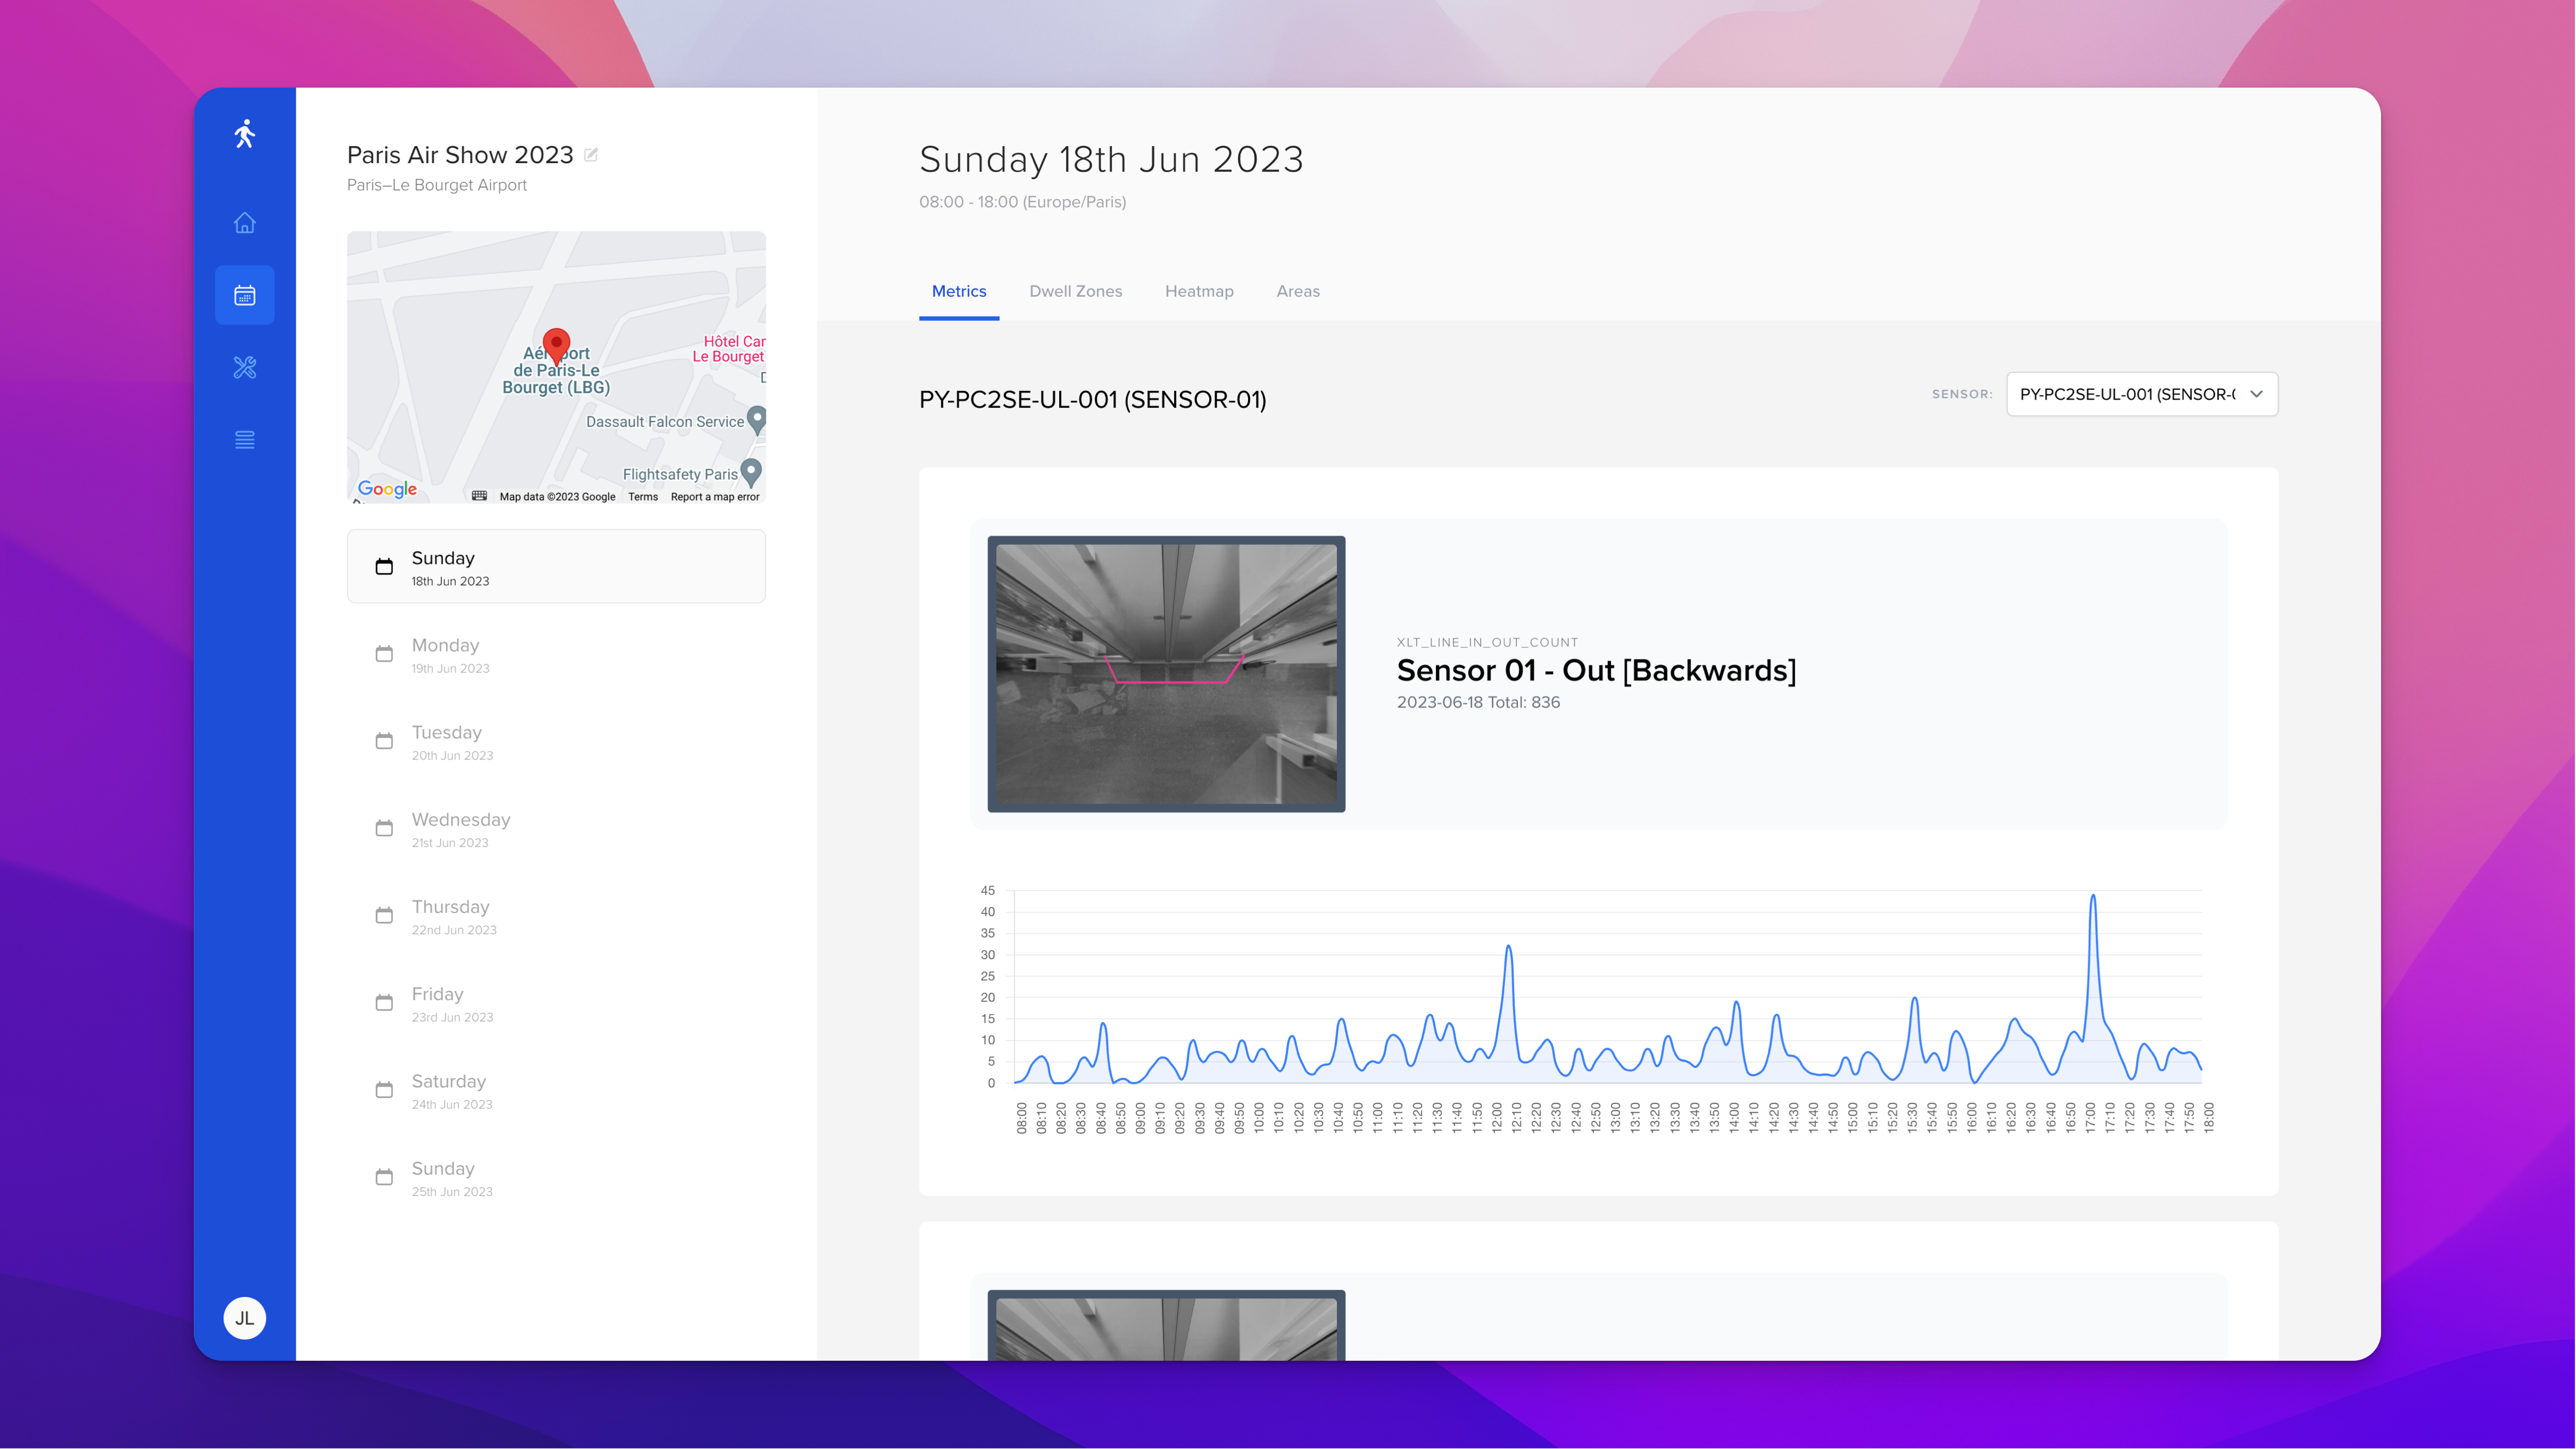
Data from the sensors is streamed to the platform and presented on dashboards in real time - allowing for instant reactions to trends. Filters can be applied to the data to add scope and delve deeper into the metrics, providing reports on specific scenarios. These filters can be applied both in real time and retrospectively with reprocessing taking only a few moments - allowing for quick responses and reports to be generated.